Dashboards
IRP Data Dashboards Catalogue
The IRP Data Dashboards Catalogue informs the ECC community about the data dashboards developed by IRP and provides an easy way to find specific metrics within each dashboard. Please click on IRP Data Dashboards Catalogue to explore the metrics offered in the dashboards.
Annual Planning Dashboard
Reports on the institutional leading indicators, which are metrics that provide information about students' progress. Tracking these measures allows programs and departments to make changes that will help with increasing student progress and reaching ECC's institutional goals.
View DashboardAcademic Program Review Dashboard
Reports course completion rates, demographics, enrollment, awards and transfer data for academic programs.
View Dashboard
Course Success & Completion Dashboards by Department and Course
The course success rate is the percentage of students who receive an A, B, C, or Pass as a final course grade out of all students enrolled as of the census date.
The course completion rate is the percentage of students who remain enrolled through the end of a course out of all students enrolled on the census date. It is the percentage of students who did not drop late or withdraw.
The dashboard includes course success and completion rates of current and four-year trends, as well as an analysis of equity gaps by race/ethnicity and gender.
Please refer to the dashboard guide below for data definitions and exercises on how to use the tool to explore and filter for the data you seek.
Course Success & Completion Dashboard Guide
View Dashboard
Degrees and Certificates Dashboard
Reports the division, program, gender and ethnicity of students who were awarded degrees and certificates for an academic year.
View Dashboard
Dual Enrollment Dashboard
Reports on enrollment, demographic, and student outcomes of high school dual enrollment students and sections.
Enrollment Trends Dashboard
This dashboard provides an overview of enrollment for the current academic year. It also allows comparisons to like terms from previous academic years and is filterable by Division and Method of instruction.
Metrics included are FTES, Fill Rate, Enrollment, Sections offered, and Waitlist count. Users can also get a demographic profile of enrolled students by various characteristics.
Enrollment Trends Dashboard with Division Breakdown
Open Sections List
Reports course section information based on metrics such as meta-major, term, day offered, start time, etc.
Student Services Dashboard
Reports demographics and student outcomes by race/ethnicity for the past four years. Outcomes include: success, course completion, retention, awards, and transfers. Students can be filtered by support program participation.
The dashboard is saved on the Student Services Dashboard (private) Teams site, as it contains disaggregated sensitive student data.
View Dashboard on Teams Site
Time to Completion Dashboard
Reports metrics for students who have completed a degree or certificate program, including units accumulated and length of time from first enrollment.
View Dashboard
CCCCO DataVista
DataVista is the go-to platform for insights into student success across California Community Colleges and Adult Education. Designed to foster a deeper understanding of student achievement, DataVista provides comprehensive metrics on student outcomes to support evidence-based decision-making at schools, colleges, and throughout the state.
While the previous suite of dashboards from the California Community Colleges Chancellor’s Office (LaunchBoard) remains accessible, it will no longer be updated, as DataVista now serves as the primary source for up-to-date student success data.
Visit CCCCO DataVista for data on the progress, success, employment, and earnings outcomes for California community college students.
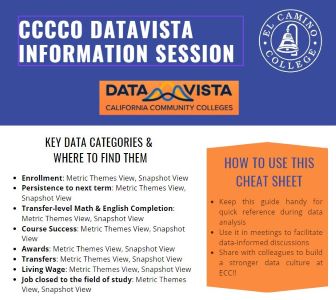
Click on the following image for information regarding DataVista navigation, quick tips for using data effectively, and other additional resources.
